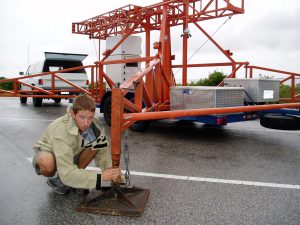
 Each of the four towers can collapse to a form suitable for travel and expand to deployment configuration within 30 minutes. The objective is to gather high-fidelity time histories of the wind velocity as the storm passes over the instruments. This data at 5 and 10 meter elevations provide an important element for engineers working to mitigate damage from extreme winds.
See a short movie illustrating a tower setup taken during Isabel.
Anatomy of a Portable Wind Tower
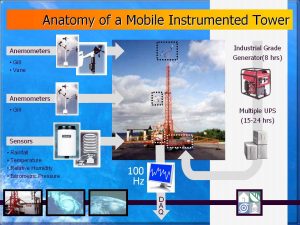
The four portable towers systems were constructed during 1998-1999. They are designed to function in up to 200 mph wind gusts. Click on the picture below to see the components of the tower in detail.

Strength and Stability
The main tower is built from a structural steel lattice, bolstered by structural steel tubing that connects the tower to its trailer. All computer, generator and battery enclosures are built from 16 gauge steel or diamond-plated aluminum. Wiring for power and data is encased in conduit for maximum protection.
Strength is complemented with several measures to stabilize the towers in high winds. The towers resist sliding and overturning from impinging wind loads through the following design implementations:
- the 5500 lbs of self-weight
- the outrigger system, which places the supports of the tower 20 ft. away from the center of the tower. This kind of configuration is analogous to pushing an upright person over. If the person keeps their feet close together, this task is easy. As the farther apart the person spreads their feet, however, the more difficult this task becomes. Engineers refer to this principle as resistance to overturning moment
- earth screws (similar to those used in manufactured housing), which are augured into the ground and attach to the end of the outriggers
Instrumentation
The instruments include two 3-axis fixed anemometer arrays at 5 and 10 meter elevations, and a vane anemometer at the 10 meter elevation. Environmental variables (barometric pressure, temperature, relative humidity, rainfall) are also collected onboard.
Data Collection
Two onboard computer systems read data from the instruments and save files every 15 minutes. The first system samples at 100 Hz (Hz = sample/second) and writes results to two hard drives in the CPU. The second system, running on a laptop and the Tower XP software (in LabVIEW), pulls data at 10 Hz. The data is post-processed and uploaded to the web, where emergency managers and meteorological agencies (eg, NOAA) can access the data. More information about the real-time data acquisition may be found in the Current/Future Efforts section of the FCMP website.
| Data Acquisition | Hardware and Software | Sampling Rate (Hz) | Hard Drives | Internet Upload |
|---|---|---|---|---|
| Original | ComputerBoards/Visual C++ | 100 | 2 | No |
| Tower XP | National Instruments / LabVIEW | 10 | 1 | Yes |
Power
An onboard gasoline generator powers a system of UPS batteries to provide power to computers and powered instruments. The tower system can operate for 24-36 hours before the generators must be refueled.
New Additions to the Tower System:
The 2003 season will see the introduction of two important new additions to the portable tower hurricane data collection system.
- Real Time data transmission to a web site
- Additional 5-meter satellite towers to deployed around each main tower.
Details of these new additions are found on the Current / Future Efforts page
Data Sets Collected
The FCMP teams have been deploying for landfalling tropical storms and hurricanes since 1998. Tower data has been collected for the following storms.
1998 – Georges
1999 – Dennis, Floyd and Irene
2000 – Gordon
2001 – Gabrielle, Michelle
2002 – Isidore, Lili
2003 – Isabel
2004 – Charley, Frances, Ivan and Jeanne
More details are provided on the Collected Data page on this site. Pictures of these deployments can be found at the Photo Gallery.
